

Paper by: Mr Chris Cunningham, Senior Associate
This paper sets out the cost benefits to an organisation who wish to reduce overall maintenance costs through rationalisation of their Preventive Maintenance (PM) strategy without increasing their overall risk to operations and still assure compliance to mandatory maintenance.
This paper focuses on the savings potential by avoiding inessential work which is wasteful of resources. The rationalisation process also addresses reliability enhancements through picking up work which is missed by the current PM strategy.
What is Preventive Maintenance?
Preventive maintenance is generally considered as system-generated routine maintenance task based on either calendar time between successive jobs or triggered by run hours as equipment is operated. This is generated by the Computerised Maintenance Management System (CMMS) in accordance with the following data model:
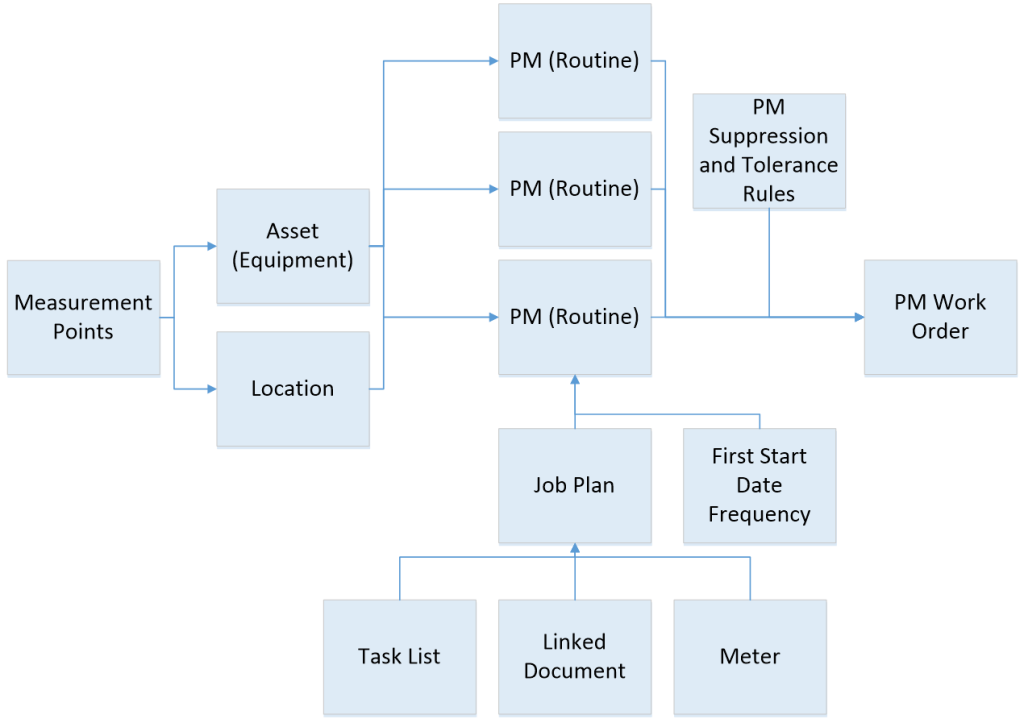
Figure 1 Data Model for PM Routines
The purpose of the PM schedule is to accommodate the following:
- Assure the overall maintenance strategy is legally compliant such that regulatory procedures are auto-generated by the PM schedule and so ensure this work gets done;
- Address likely failure modes in the equipment through inspection, lubrication or calibration, and thereby generate follow-up work are typically condition-based repairs; and
- Schedule anticipated change outs or likely repairs based on an understanding of how frequently components are likely to need replacement under normal operating conditions.
The transition from a purely maintenance support approach to a true asset management approach in the care of assets requires the PM work to inform the organisation on the condition of the assets. In this way decisions are optimised for life cycle investment such as capital renewal, and assurance of operational continuity is achieved by anticipating losses before they arise.
The timing at which PM work will be triggered is one of three criteria:
- Calendar time frequency (the most common which presume steady operation);
- Measure of operational duty e.g. run hours from run meters, distance travelled or number of duty cycles; and
- Number of specific operations e.g. hoist lifts

Why do a PM Rationalisation Exercise?
McAdam and McCormack (2001) conducted a survey identifying three states of competitiveness which drive managers towards considering process improvement methods:
- A company in crisis;
- A company in a strong competitive position, but envisaging greater competition in the future
- A company in a strong position, and wanting to capitalize on that position
As existing industries struggle to maintain their competitive stance in the market place, an obvious target with any value stream exercise is to assess the effectiveness and costs of the maintenance department. This department stops equipment and is a major source of expenditure. The question then is: “how does an organisation get the best value out of its maintenance department?” An immature approach is to arbitrarily starve the maintenance budget (e.g. 3% cost down per annum) and fix equipment when required. This always leads to longer term outlay in asset renewals and premature asset replacement, with higher costs incurred in the long run. In addition, the consequent fall in reliability has a major hit on revenue and business confidence, impacting business confidence.
Rationalising the preventive maintenance baseline can provide immense value to the organisation where the underlying focus is to work on the right asset at the right time. On average, modern organisations are spending up to 65% of their maintenance resource hours PM work committed by the maintenance system. Hence the organisation must ensure maintainers are doing this type of maintenance for the right reasons:
- The PM work is mandatory, including tasks specified by external regulations;
- The work is essential for day-to-day care, e.g. lubrication, calibration, adjustments etc.;
- The timing of the work addresses known failure modes at a time anticipated to allow remedial work before the damage is excessive or reliability degraded; or
- The organisation needs to know the condition of the assets, particularly the risk of any hidden failures and in time to allow forward planning of renewal work.
Measuring the Value of a PM
A comparison of two identical Powder Driers is shown the figures below to demonstrate increasing the frequency of PM routines does not always correlate with better reliability.
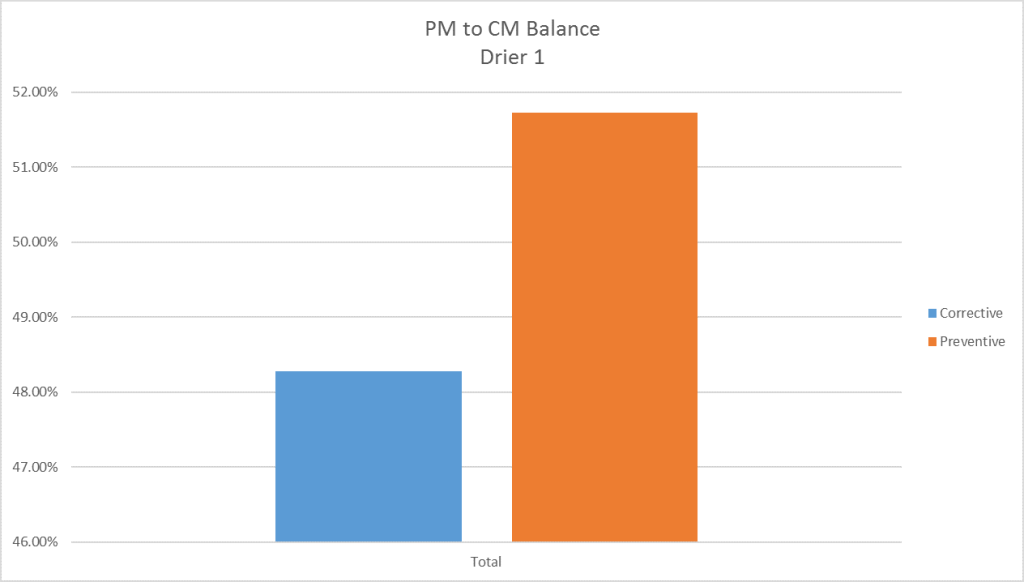
PM work is nearly 50% of total work.
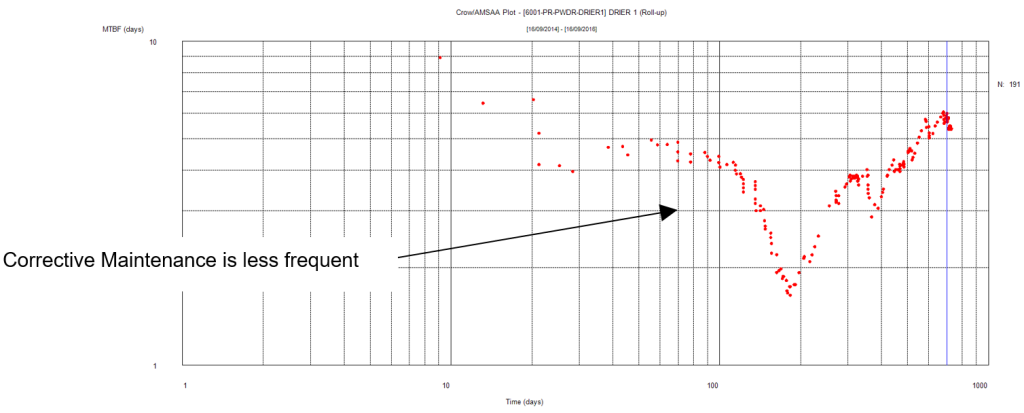
The Reliability growth plot shows over a 2-year period the frequency of corrective maintenance has gradually decreased. PM work is nearly 85% of total work
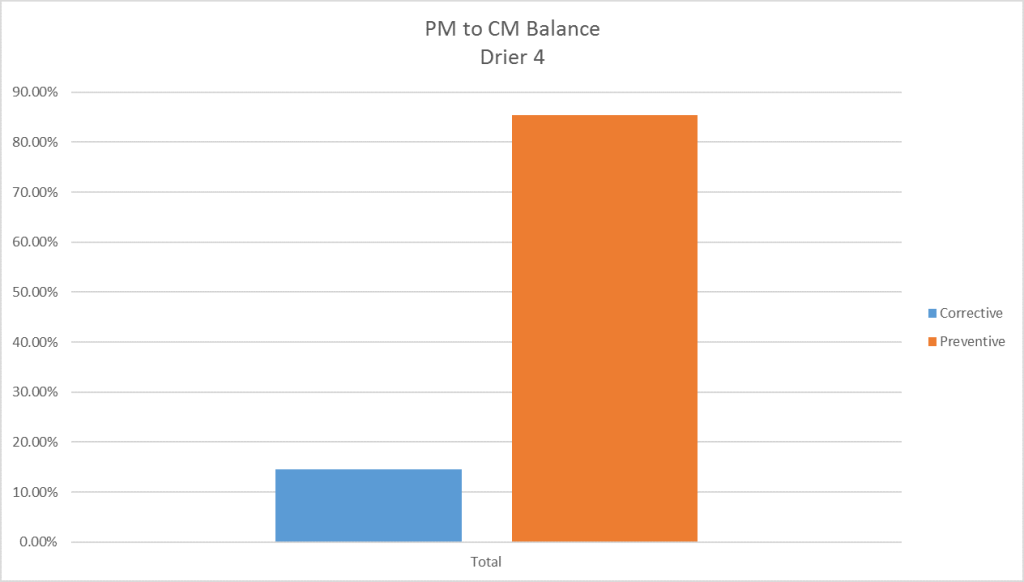
Reliability growth plot shows over a 2-year period the frequency of corrective maintenance has increased by 100%
Reasonable guidance when assessing the effectiveness of a PM routine is a 3-6:1 ratio to corrective maintenance i.e. generate a corrective job such as a loose belt for every 3-6 belt inspections. When the PM/C ratio > 3 there is a need to assess the validity of the routine. The task lines need to be assessed to see if any can be adjusted to manage down instances of corrective work by preventing a problem at its inception. When the ratio approaches >15:1 and there are still significant numbers of corrective maintenance jobs, then clearly one of the following possibilities is happening:
- The tasks are wasteful and can be backed off in frequency, thus freeing up maintenance resources or reducing cost; or
- The working environment is particularly benign (eg clean, room temperature, etc.) and further allowance can be taken to again reduce the frequency of PM work.
Where the PM/CM ratio is < 3 then it is likely that the PMs are ineffective and cost savings could be sought by a complete review of the PMs, e.g. a 3 monthly PM check is not addressing failure modes occurring on a weekly basis. In such cases, there is a need for frequent surveillance such as operator checks or routine weekly/monthly simple checks aligned with less frequent PM intervention for intrusive checks and time-based replacements. Condition monitoring and frequent inspections can replace longer term PM work such as fixed time replacement of components, but the strategy needs to be designed and then implemented in the CMMS including periodic and frequent condition assessments (or reliance on in situ monitoring) as well as unscheduled but planned renewal tasks, which can be triggered by condition measurements. The PM rationalisation process considers these options by asking the following questions:Where the PM/CM ratio is < 3 then it is likely that the PMs are ineffective and cost savings could be sought by a complete review of the PMs, e.g. a 3 monthly PM check is not addressing failure modes occurring on a weekly basis. In such cases, there is a need for frequent surveillance such as operator checks or routine weekly/monthly simple checks aligned with less frequent PM intervention for intrusive checks and time-based replacements. Condition monitoring and frequent inspections can replace longer term PM work such as fixed time replacement of components, but the strategy needs to be designed and then implemented in the CMMS including periodic and frequent condition assessments (or reliance on in situ monitoring) as well as unscheduled but planned renewal tasks, which can be triggered by condition measurements. The PM rationalisation process considers these options by asking the following questions:
- What frequent PM work is not followed up on a routine basis by predictive or condition-based repairs;
- What equipment has excessive levels of PM work compared to its rate of corrective maintenance; and
- What PM checks lead to results which can be covered in other ways such as continuous monitoring or as part of other, more efficient routines?
The PM Rationalisation Process
There is always an inherent risk when implementing a Rationalisation project:
- What the risk from deleting PMs or extending their frequencies will affect;
- Safety and environment considerations;
- Business impact from temporary downtime of the assets affects; and
- Risk to asset integrity due to lack of inspection data.
Hence the process utilises a risk-based approach to ensure the correct decisions are made with each opportunity to manage down the PM rate such as deleting the PM or reducing its frequency. Where the risk is found to be intolerable with the current strategy, the process will also recommend either increasing the frequency or modifying the tasks within specific PMs.
There are four stages in Rationalisation which not only ensure risk is identified and mitigated, but also that the correct people are involved in the process. These include:
- Data Interrogation
- First Pass Review/Candidate Validation
- Risk Review
- Candidate Cost Benefit Analysis
STEP 1 Data Interrogation
Data interrogation analyses data sources such as CMMS work order history, condition monitoring results, problem cause codes etc. with the purpose of identifying:
- Assets in distress/reliability reporting;
- Modes of failure; and
- PM utilisation.
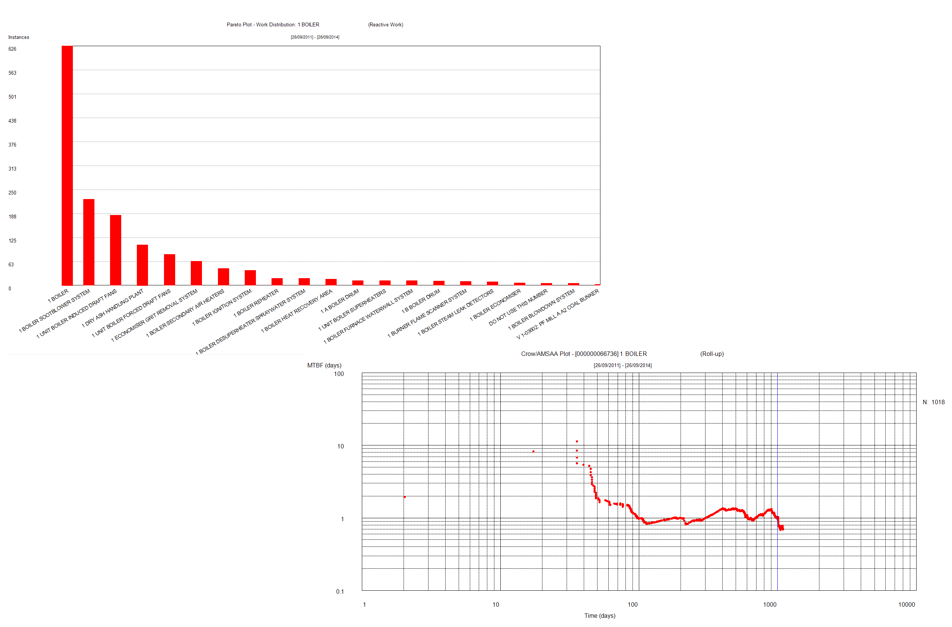
Figure 3 Asset Health Reporting
Assets that are showing signs of deteriorated health (increased frequency in corrective maintenance) typically have PM routines that don’t address the underlying cause of failure. In this instance, it imperative to review those PM routines to see if:
- They are still applicable for that type of asset given its age, state of deterioration and mode of operation; and
- They identify the most probable modes of failure associated with the type of asset (eg we do several gland changes as PMs, yet we seem to always have bearing failures).
PM routines are stored as standard jobs in the CMMS, and are then assigned to a specific asset or system of assets. It is important to review these PMs as they are applied to the assets rather than considering the generic job plan.
A PM effectiveness report (shown below) is generated through the analysis indicated above using for example, 3:1 PM:CM as a benchmark for the effectiveness of the PM. Note that it is considering PMs applied to specific assets.
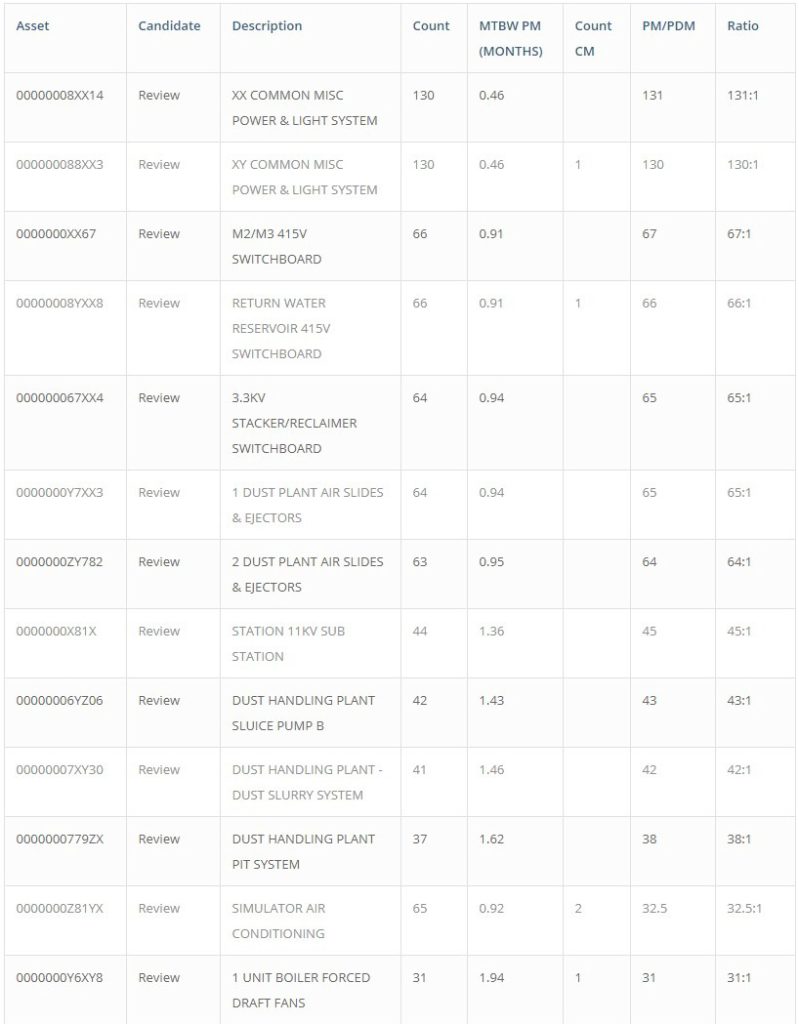
Table 1 First Pass PM Candidate Report Example
STEP 2 First Pass Review and Candidate Validation
This step is a two-part process that encourages multiple stakeholder buy-in, particularly at the trade level. This is conducted through a workshop which consist of key personnel from each plant work group and allows them to identify any PM improvement opportunities from a “front-line delivery” perspective. This approach is particularly important when maintainers struggle to book maintenance work in the CMMS to the asset itself.
The second process is to document the feedback from the workshops and the candidate list is re-evaluated to include these recommendations. The feedback is reported so the organisation can assess who said what and when, which is a critical test of the credibility of such recommendations.
A PM routine will be processed as a candidate for review based on typically three (but not limited to) key parameters, including:
- Equipment/routine redundancy – While the CMMS captures redundant assets some newly decommissioned assets may still be generating maintenance routines. This also includes a review of inactive job routines.
- Effectiveness – A preventive routine is regarded as effective when it is generating specific corrective maintenance work which relates to likely modes of failure for that asset. While the target ratio of 3 PM’s to 1 corrective job may be considered, it is not uncommon to find assets with a ratio of 200 PMs:1 corrective job.
- Duplication – There may be instances where multiple routines have been created to undertake the same kind of job. This will particularly be evident when comparing operator procedures and high frequency maintenance routines.
The figure below demonstrates reporting of Rationalisation candidates. Each asset will have at least one and in most cases, several job routines assigned to it. It is at this point where the optimal routines are then identified
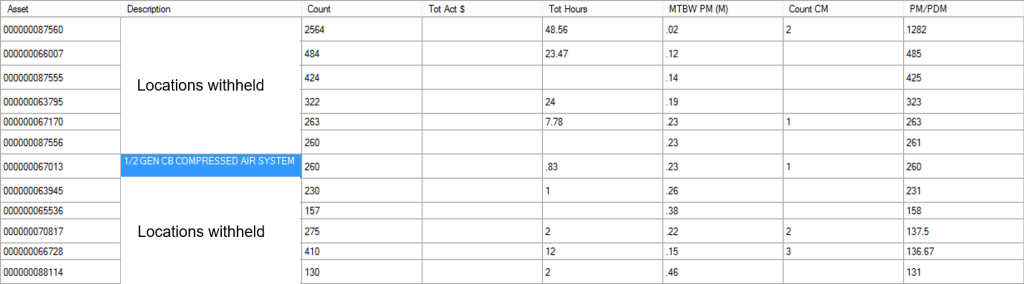
Figure 4 Asset Candidate Review
STEP 3 Risk Review
Job routines that are identified as candidates for removal or reduction are then analysed for risk, i.e. criticality of the work. Asset criticality is a risk management measure as to the significance when an asset fails to provide its intended function, and considers:
- Compliance risk which in specific cases can be extreme (e.g. safety, operating licence);
- Impact on the operation of the overall facility, which can be stopped and not produce;
- If the assets were destroyed, their replacement would take so long that the economic harm would be substantial; or
- At the reverse end of the scale, if the assets failed it would be inconvenient or unsightly, but there is no real risk to people, environment or the business.
A key point to make is that not everything is of high criticality. The criteria by which criticality is set is based on the likelihood of realising a loss in one or more of the following categories[1]:
- Safety – risk to human beings;
- Asset loss – risk to the capital investment where a major system or machine must be replaced;
- Financial loss – potential to lose money through stoppages or simply a downturn in the nameplate rate of the assets;
- Environment – risk to the environment and of the operating licence;
- Reputation – risk of adverse perception by the local community, national or international audience
- Consequence – categories are determined on the basis that the component being addressed by the PM (e.g. Gearbox, bearing, motor, etc.) fails catastrophically (i.e. without warning and without standby plant). In the case of financial loss, the duration is determined by MTTR; spares availability; etc. The $/operating output value from the current year’s financial planning process is used to calculate lost revenue.
- Likelihood – the likelihood being assessed is that the consequence will occur without warning and/or without standby plant as assumed in the Consequence assessment. That is:
- Is the plant being monitored? (Remote monitoring or predictive technologies deployed); or
- Is there >= 100% standby plant? (Redundancy).
(This process is applied purely for the purposes of determining the PM approval authority only. It is NOT an assessment of the likelihood of failure, which would require an MTBF analysis.)
Two Yes answers: Likelihood is Low (Organisation risk Matrix Likelihood Score 1)
One Yes, One No: Likelihood is Medium (Organisation risk Matrix Likelihood Score 2)
Two No answers: Likelihood is High (Organisation risk Matrix Likelihood Score 3-6 range)
The risk is then assessed as follows:
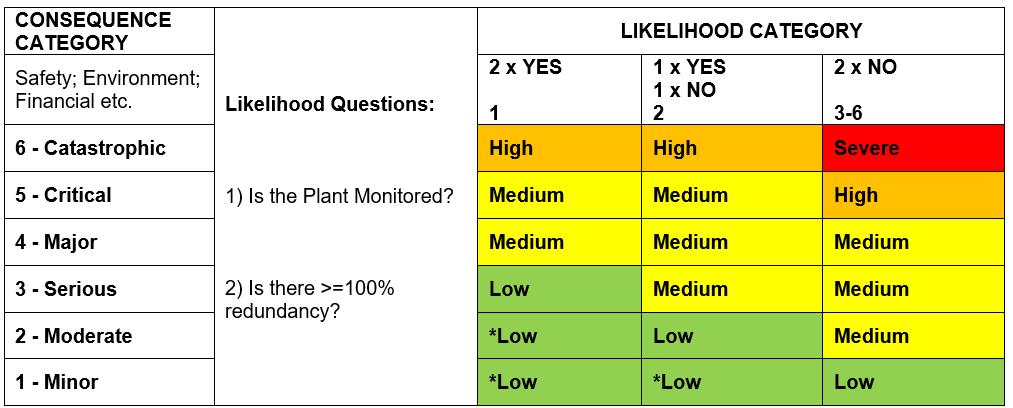
Figure 5 Delegation of Authority Example
The organisation’s risk escalation authority is used as the basis for authorising changes to a PM. For example, a high-risk asset will need General Manager delegation whereas a low risk asset can be approved with an Engineer’s delegation.
STEP 4 Candidate Cost Benefit Analysis
The overall objective of PM Rationalisation is to be able to reduce maintenance costs whilst not exposing risk such as asset integrity, availability, etc. Once the candidates have been validated it is then modelled on three different scales; labour reduction, cost reduction and reliability improvement.
Labour is generally a fixed cost and can easily be modelled to show how much labour is ultimately required to perform preventive based maintenance. If an organisation sets out to reduce the Full-Time Employee (FTE) count, the revised labour requirement must coincide with this.
The Cost reduction can be a bit more dynamic than the labour reduction model as there are several variables that give a true cost saving. These include:
- Material cost;
- Services cost such as scaffolding; and
- Additional labour such as a specialist.
The above variables are generally found in the first phase (data interrogation) of the PM Rationalisation. If the data can’t be found in the CMMS, further analysis will be needed using the financial system to estimate the cost of work orders.
The figure below shows a revised cost model versus actual cost for performing routine based maintenance across the organisation.
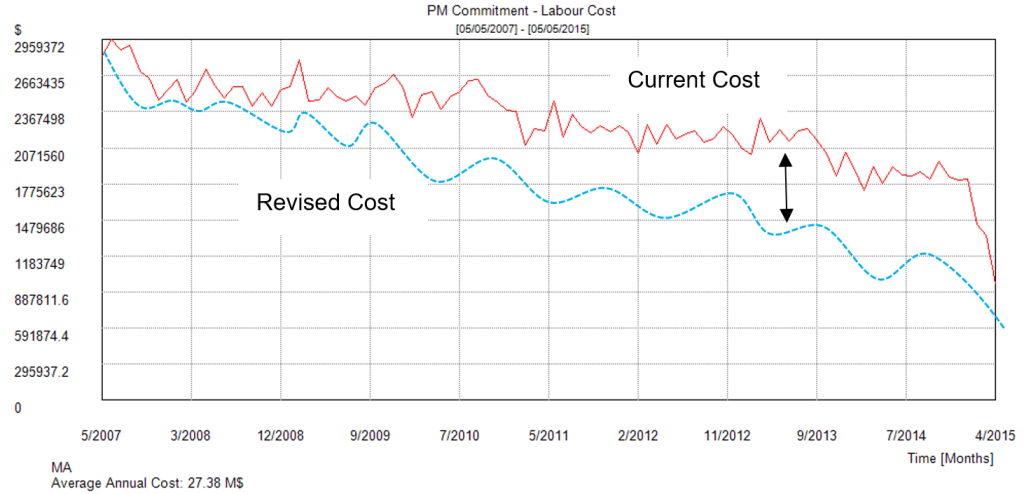
Figure 6 Cost Benefit Model (Example)
Case Study
The case study used in this section is a series of Australian power stations consisting of; Fossil Fuel, Natural Gas, Coal Seam Gas, Cogen, Wind and Hydro. Each station had clear directions to reduce maintenance costs and reduce the FTE head count. While the identification of the organisations has been supressed, the potential for true cost savings in each case has been retained.
CASE 1 Fossil Fuel Power Station
The table below shows the total annual cost savings for each plant group i.e. electrical, mechanical etc. where there was a 46% total cost saving.
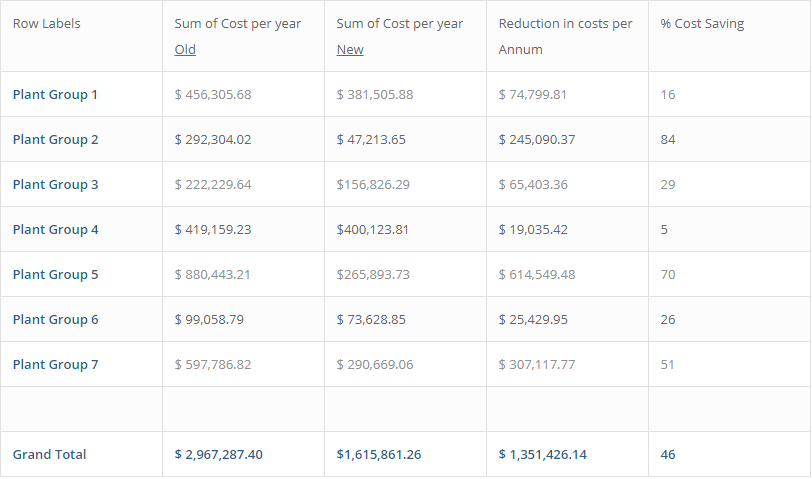
Table 2 Maintenance Team Group Cost Savings
The table below shows the annual labour hours saved for each plant group where there was a 40% total labour hour saving. The equates to roughly 13 FTE’s.
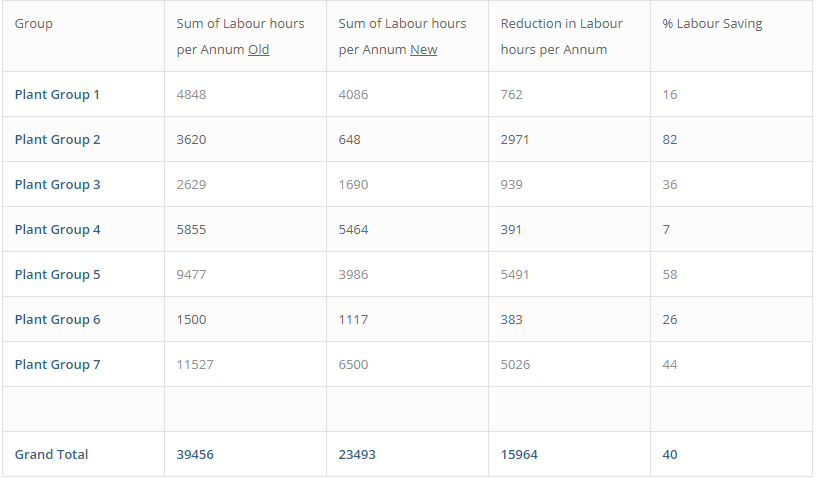
Table 3 Maintenance Standard Labour Hours per Annum Comparison
The next table shows the annual operation isolation permits per annum savings for each plant group. This is an annual saving of 330 permits (29%) to be processed per annum for PM (Routine) related work.
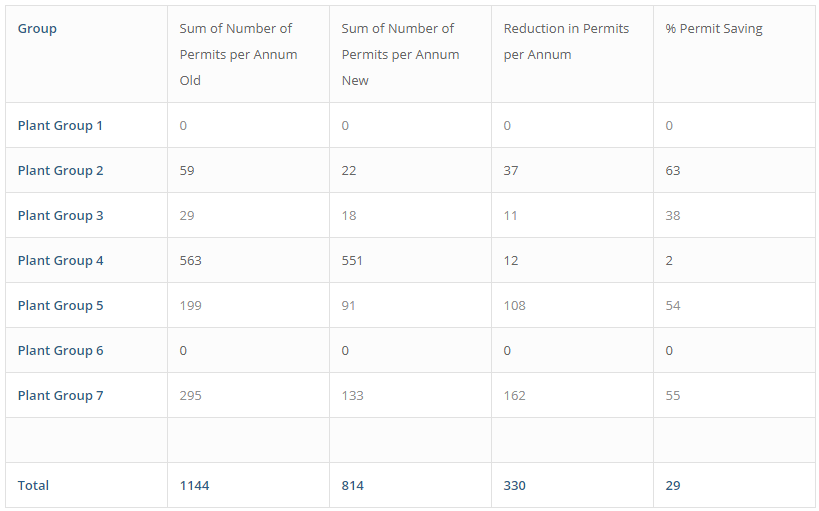
Table 4 Maintenance Standard Job Permits per Annum
CASE 2 Gas and Renewables Power Stations
The table below shows the total annual cost savings for each plant group where there was a 2.62% total annual maintenance cost saving
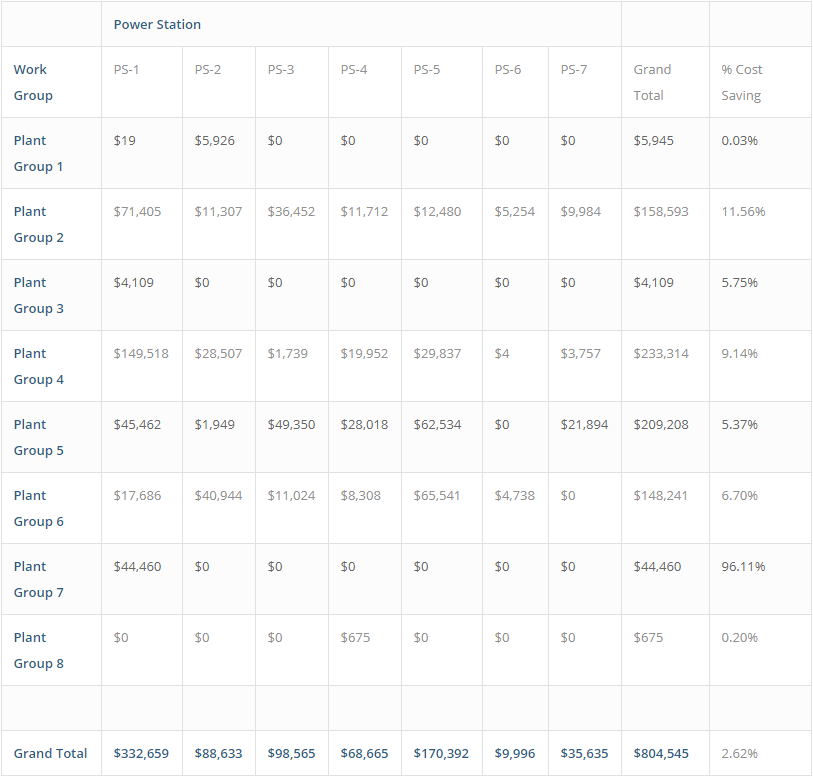
Table 5 Cost Savings Per Year
The next table shows the total annual labour hour savings for each plant group where there was a 2.38% total annual maintenance labour hour saving. This equates to roughly 6 FTE’s
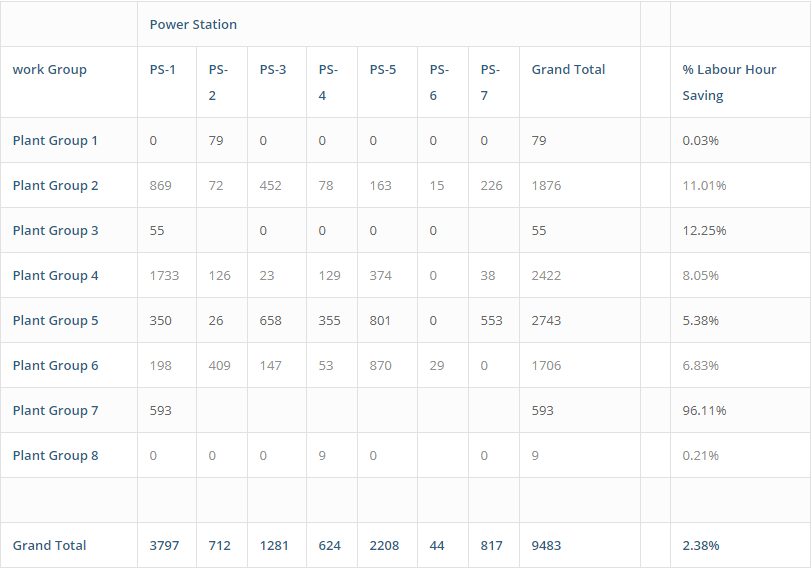
Table 6 Labour Hours Saved
Summary
In summary, rationalising the preventive maintenance baseline can have a substantial impact on reducing the operating costs of an organisation whilst not imposing intolerable risk to the business. A consistent process has been applied with measurable benefit, freeing up resources to be applied more advantageously to improve the asset base or redirected to reduce costs.
References
McAdam, R., & McCormack, D. (2001). Intergrating business processes for global alignment and supply chain management. Business Process Management Journal, 7(2), 113-130.
[1] This may differ for other organisation based on their risk management policy